The Murray Grey Supermarket Index with credit for all material to BREEDPLAN and the Murray Grey Beef Cattle Society in Australia.
Supermarket Index - Estimates the genetic differences between animals in net profitability per bred cow for a herd targeting steers for the supermarket trade. Steers are either finished on grass or grain (50-70 day) and slaughtered at 17 months, average live weight of 1000 lbs. Daughters are retained for breeding. In response to industry feedback regarding eating quality and tenderness, a small premium has been placed on marbling.
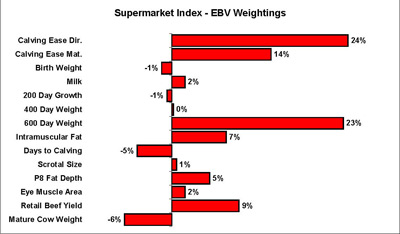
The following bar graph shows the key economic traits that are important in the Supermarket Index. The different trait emphases reflect the underlying profit drivers in a commercial operation targeting the supermarket market.
Considering the genetic relationship between the key profit drivers and the EBVs that are available, this transposes to the following EBV emphases. The sign indicates the direction of the emphasis. For example, greater 600 Day Weight EBVs and shorter Days to Calving EBVs are favoured.
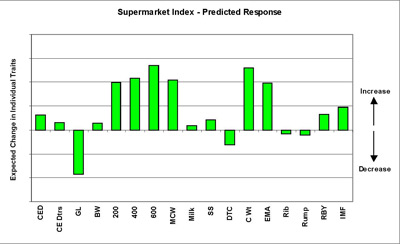
While the graphs on the previous page show the different profit drivers and emphases that have been placed on each EBV within the Supermarket Selection Index, they do not illustrate the likely change that will occur to each individual trait if producers select animals using this selection index. The response to selection will also be influenced by such factors as the genetic relationship between traits and the animals that are available for selection. For example, while there is a no direct weighting on 400 Day Weight in this selection index, it would be expected that growth to 400 days would increase as there is a large weighting on 600 Day Weight.
The following bar graph provides an indication of the relative change that would be expected in each individual trait if producers select animals using the Supermarket Selection Index. The graph reflects the relative change if the Murray Grey Published Sires (at the Summer 2009 Murray Grey GROUP BREEDPLAN analysis) were ranked on this selection index and the Top 10% selected for use within a breeding program. The response to selection may differ if a different group of animals were available for selection.
As a participant of BREEDPLAN Performance Recording, and with credit and thanks to the Murray Grey Beef Cattle Society in Australia, we provide the following PDF file for the top 100 Murray Grey Sires in the Supermarket Index. We have highlighted those bulls we use in our breeding program.
Top 100 Sires in the Supermarket Index